
Globalboiling is loading lots of data! Please wait at least 30 seconds!
Please consider supporting my Patreon. This site is free and has been since the 2000's
Buy Best Selling MP3 Downloads

See the Movers and Shakers in Music now!


Click Here to email this page link to a friend or skeptic!
Tweet
Today's weather forecast
Tweet Current United States Weather Radar Mosaic
Tweet
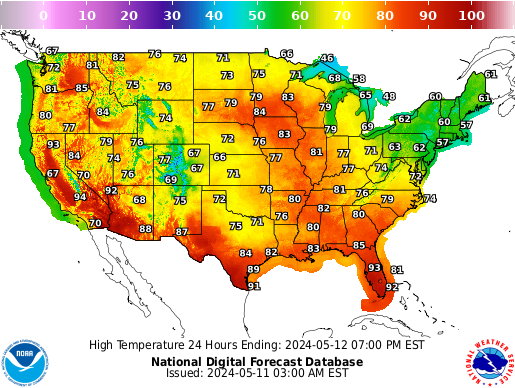
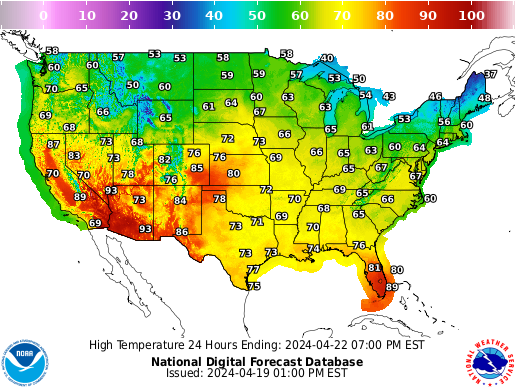
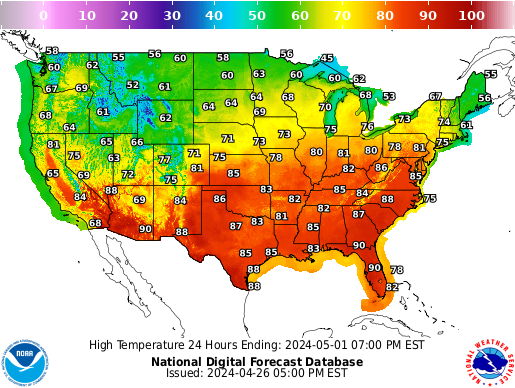
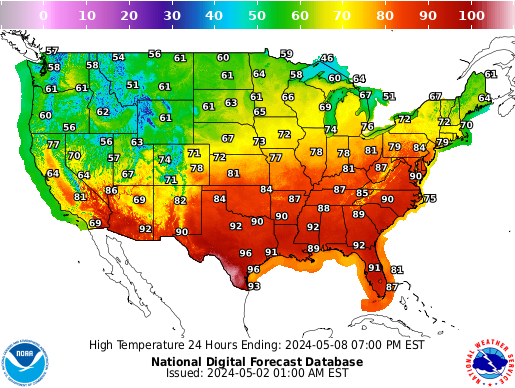
High temperature predictions for today

Tweet
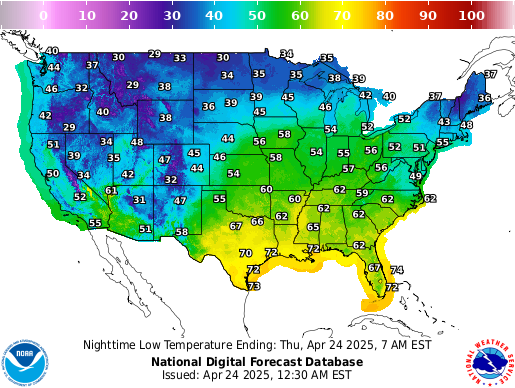
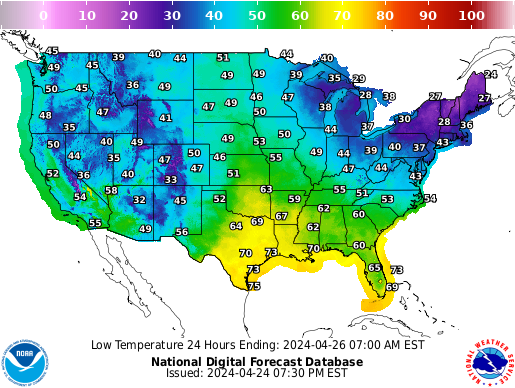
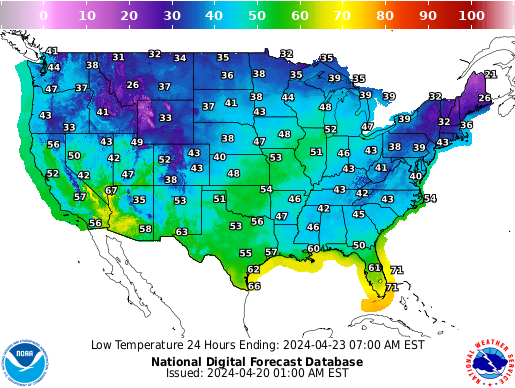
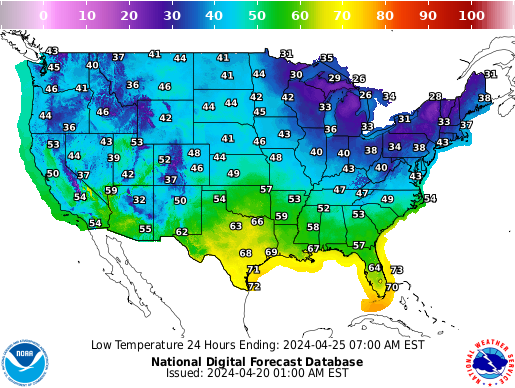
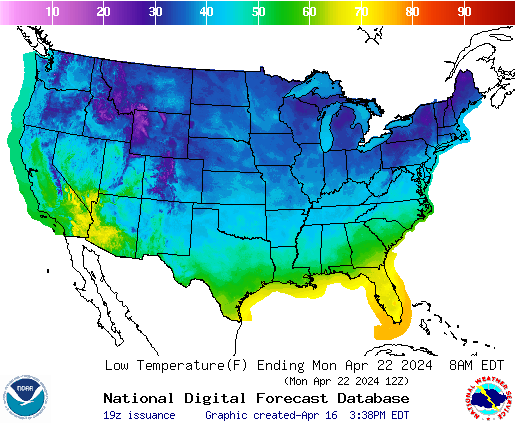
Low temperature predictions for today
Tweet national weather loop (SPC Activity Chart)
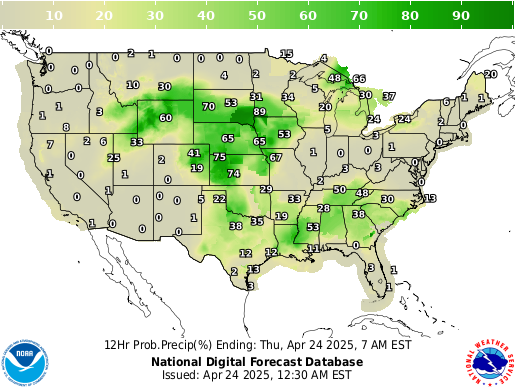
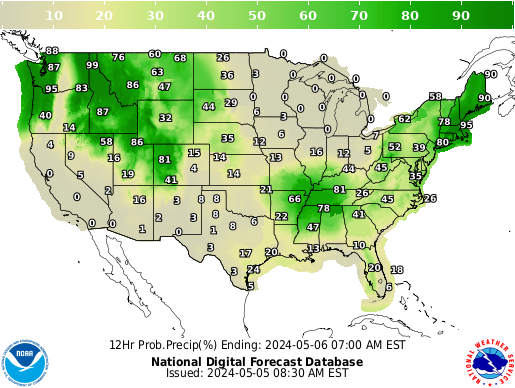
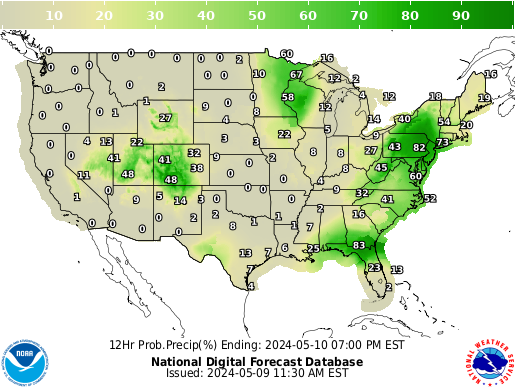
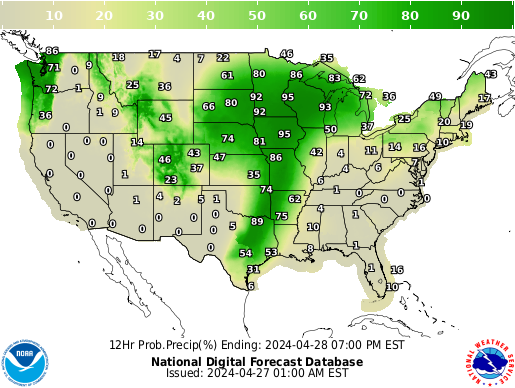
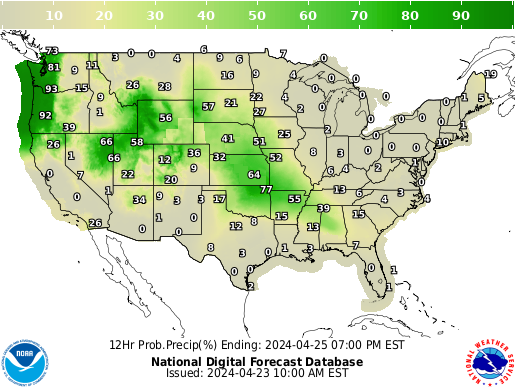
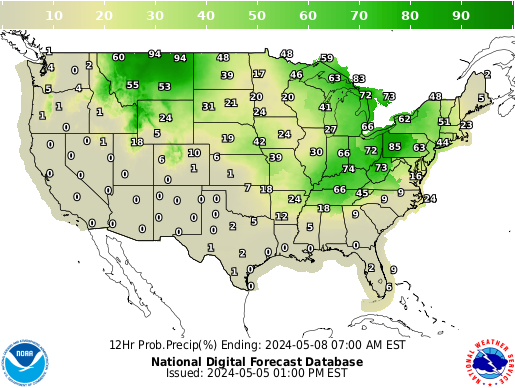
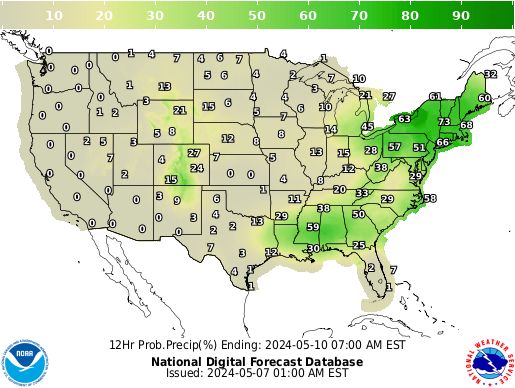
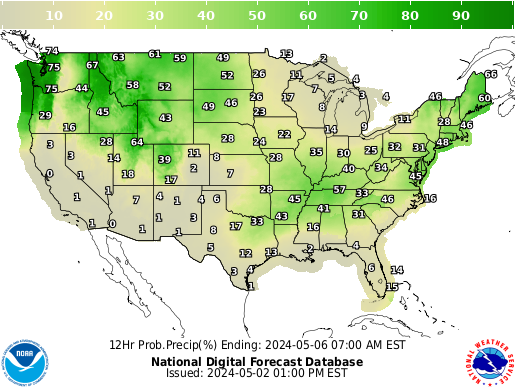
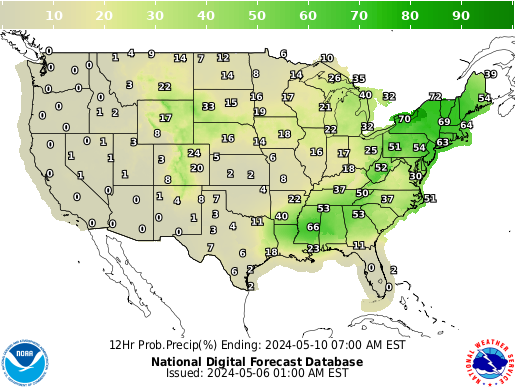
Tweet Will it rain? Is it going to rain? Percentage Chance of rain today in the next twelve hours
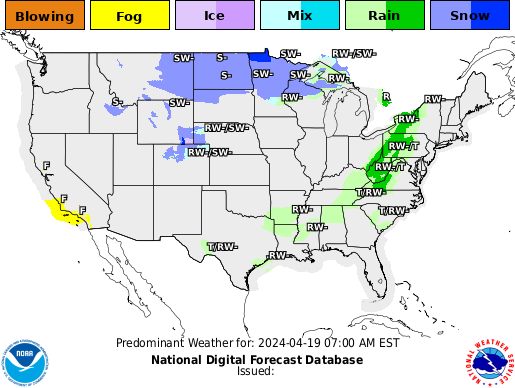
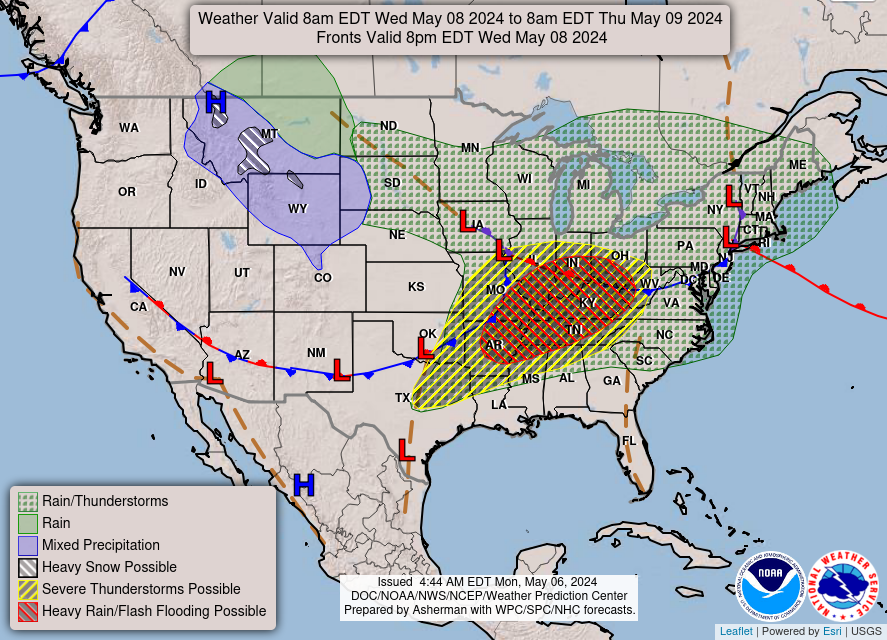
Tweet What will the weather be today? Predominant weather for today

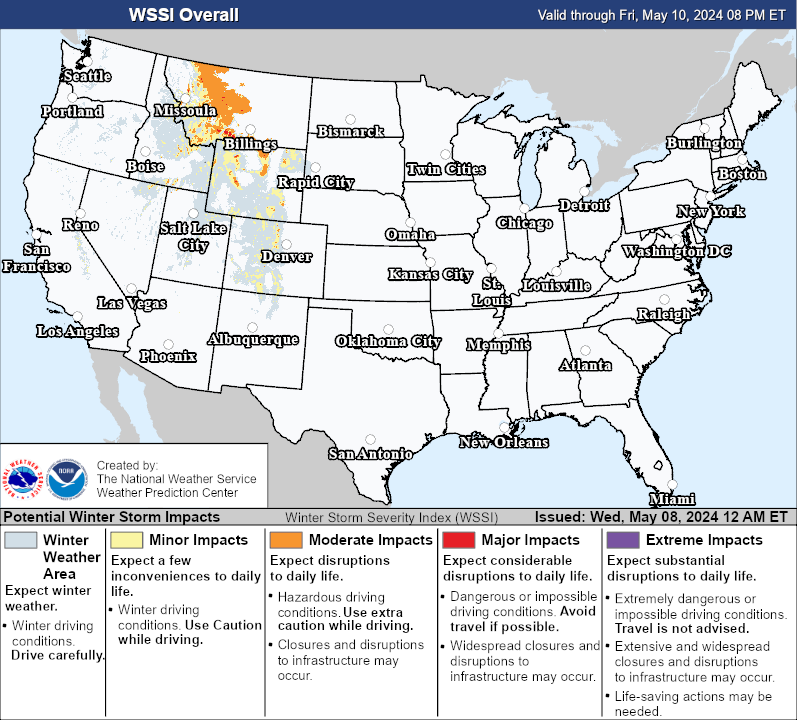
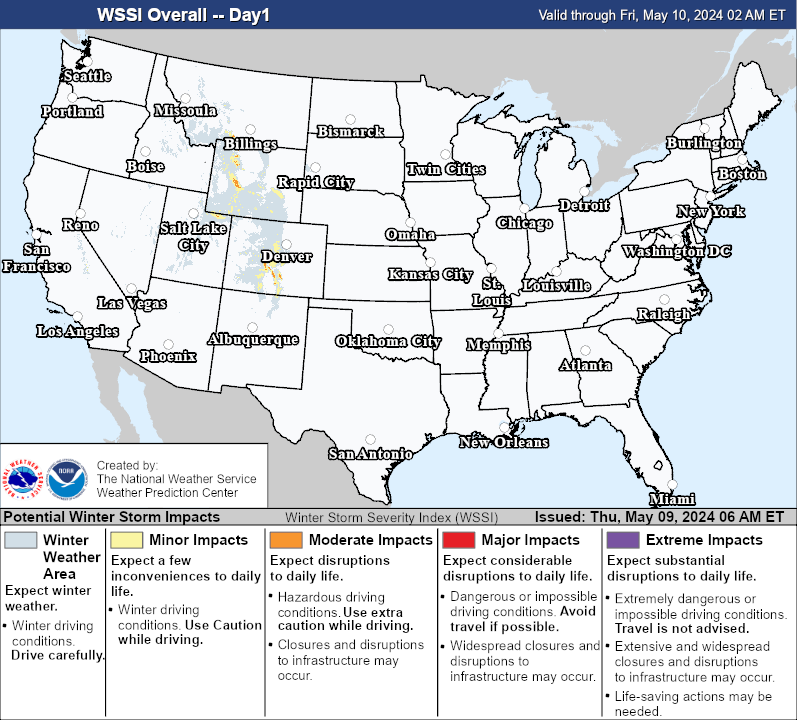
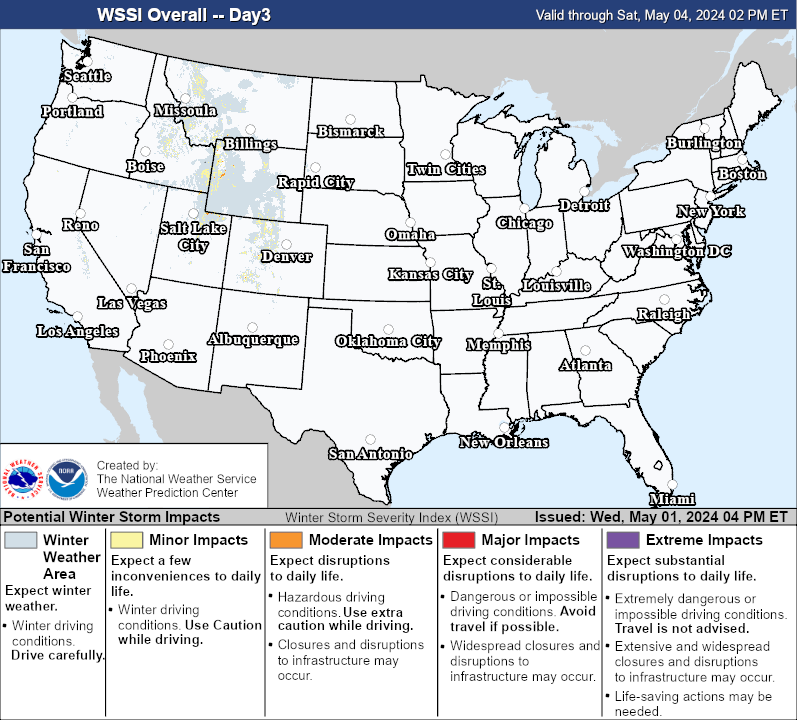
Tweet NWS/SPC Watch, Warning, Advisory Display

Tweet NOAA satellite image of the Atlantic Now


Tweet NOAA 7day Graphical Tropical Weather Outlook Atlantic

Tweet National river flooding data
Tweet National lighting strikes
Click here to see the latest popular music!
Click here to see TheBestScienceFiction
Current California U.S. Drought Monitor

<!- this will no longer be in weather video since original image no longer of the same name -->
|
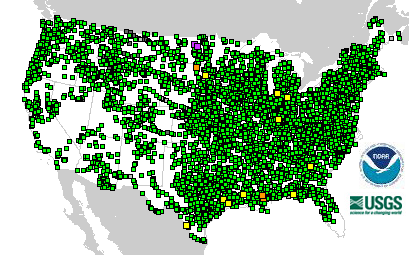
The colored dots on this map depict streamflow conditions as a
percentile
, which is computed from the period of record for the current day of the year. Only stations with at least 30 years of record are used.
The
gray circles
indicate other stations that were not ranked in percentiles either because they have fewer than 30 years of record or because they report parameters other than streamflow. Some stations, for example, measure stage only.
|
Current Day1 Fire Weather Outlook
Click here to see the latest popular music!
Click here to see TheBestScienceFiction
Latest Hurricane and Tropical Storm Tracking
NOAA satellite image of the Atlantic Now
NOAA 5day Graphical Tropical Weather Outlook Atlantic
NOAA satellite image of the Pacific Now

NOAA 5day Graphical Tropical Weather Outlook Pacific

All images are the live current images from government sources such as The National Hurricane Center. Most update hourly. Sea Surface Temperature (SST) images update weekly. Check often when storms approach!
Sea Temperatures right now
LIVE WEEKLY IMAGE! Red, Orange and Yellow areas are the warmest ocean temperatures. When hurricanes hit these areas they grow strong FAST. Hot water is gasoline for hurricanes. Compare the storm clouds in the image above and below and notice how they grow in exactly these red areas. When water was cooler in summers past hurricanes didn't get so strong.Austraila typical sees strong storms in the USA's winter.
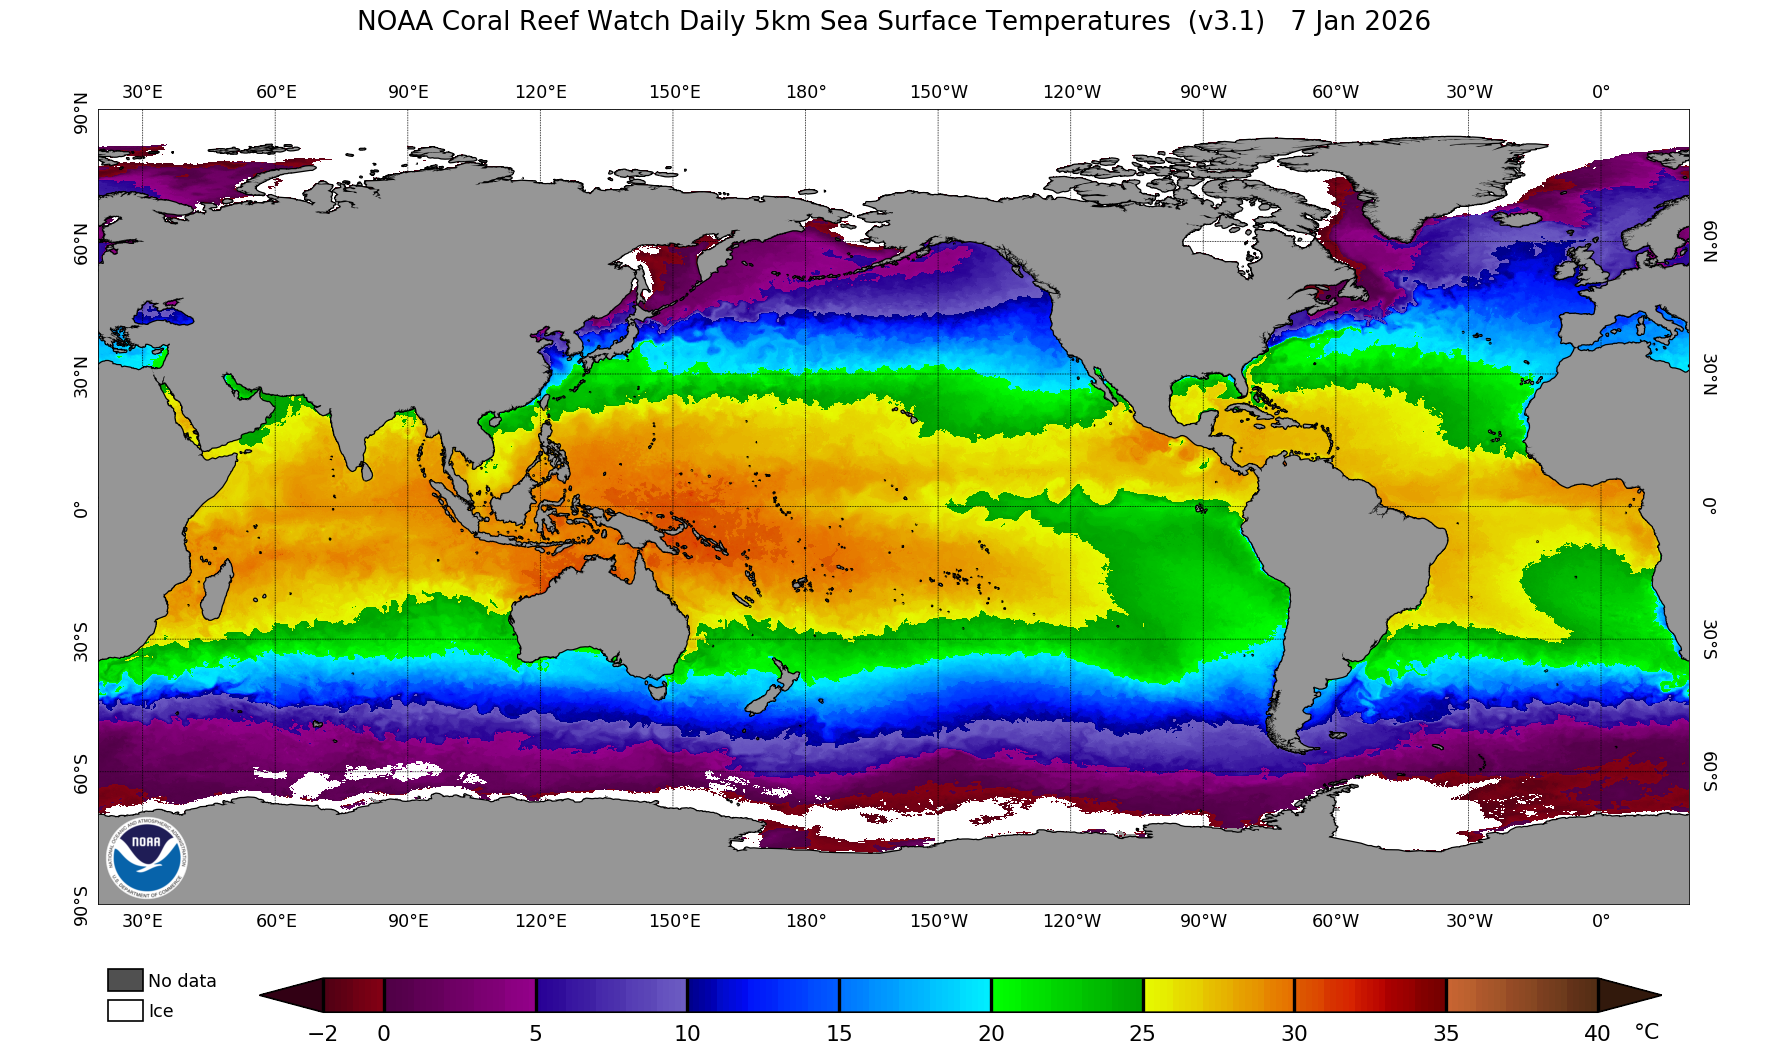
It isn't just global warming any longer. It's now the global boil and it's happening and will cause super hurricanes the rest of our lives.

Atlantic Global satellite image - Florida is just above the image center
LIVE IMAGE! Watch hurricanes form here right off the coast of Africa weeks before they make the news!

South Pacific Global satellite image -Australia just below center, Japan above center, China left of center LIVE IMAGE! This is a view of the Pacific Ocean and Asia west of Hawaii. Notice the Hawaiian islands outlined on the far upper right side at the edge of the globe. Keep an eye on storms approaching those islands. Hawaii is at great risk from the new superstorms too! And also realize that storms approaching Japan and Asia can affect prices of electronics and chip markets.
Typhoon path prediction in the Pacific LIVE IMAGE! This is a view of the predicted paths of current Typhoons in the Western Pacific near Japan, Korea and China.

Pressurewaves This LIVE satellite image shows the current low pressure waves in the Atlantic where hurricanes can form.

Click here to see the latest popular music!
Gulf Closeup
This LIVE satellite image is a closeup of the Gulf and Atlantic ocean. Know what is coming a week ahead.
Notice how cloud formation match low pressure areas (marked with "L") in image above

Gulf Movie Loop
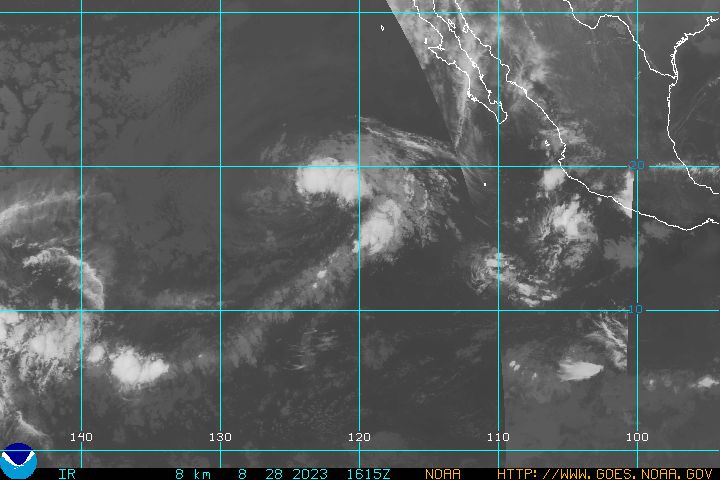
Pacific Ocean
LIVE IMAGE! This is a satellite image closeup of the Pacific ocean off Mexico and the California Coast. We had three hurricanes at once here Sept 19th and the news didn't even tell you because none were near land! Hurricanes off Mexico can cause extensive flooding, mudslides and property damage in California from many rainy days in a row. Know if the rain today is a short storm or the first of many days in a row. Keep watch here and protect your property!
Global view Pacific Ocean
LIVE IMAGE! This satellite image shows most of the whole Pacific ocean. Mexico and the California Coast above and right of the center. Hawaii is just left above the center. South America is to the lower right of center. New Zealand can be seen near the very bottom left.

Gulf Close up LIVE IMAGE! This satellite image of the gulf coast shows you if Texas or the Gulf states of Lousiana, Mississippi, Alabama, or Florida are going to be hit again.
Temperature anomalies Wondering if it usually gets this hot? Of course it doesn't no matter what the politicians say. This current satellite LIVE WEEKLY IMAGE shows you just how MUCH hotter areas of the sea especially the gulf are than normal. Orange and yellow areas in anomalies are hotter than past averages. A yellow area is at least 1 degree centigrade hotter than in the past. Orange areas are several degrees hotter!
This additional LIVE CLOSEUP WEEKLY IMAGE of ocean temperatures anomalies shows details of water temperatures hotter than normal - Hotter water is gasoline for Hurricanes
This additional weekly history of Atlantic ocean warmth and higher than normal anomalies shows water temperatures hotter than normal - Hotter water is gasoline for Hurricanes
Click here to see the latest popular music!
Click here to see TheBestScienceFiction
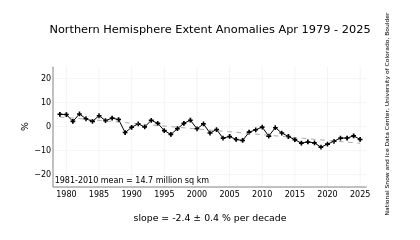
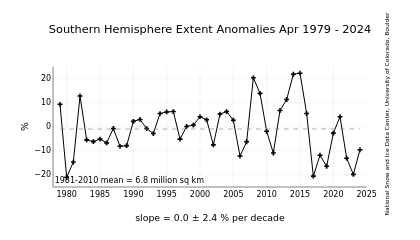
Melting Poles/ The Polar ice caps TODAY - updates every day
On Aug 31 2008 For the first time since HUMANS HAVE BEEN ON EARTH the North Pole Ice cap is now an island. Ice retreated from BOTH the full Russian and Canadian coasts! The implications of the new shipping routes around the north of Canada and Russia are staggering. Russia now has direct northern shipping routes for oil and goods. Canada has issued a statement claiming its rights to its side of the passage around the pole. All ships must notify Canada before taking the route. The strategic and oil shipping energy implications of the equivalents of two new Panama Canals can't be overestimated. The routes cut 4000 miles off the shipping route from Europe to Japan for example. It's likely the north Pole will always be an island from this summer forward.
This IMAGE shows Daily Radar measurements of ice levels at the North Pole (The South Pole is on the right) -Light Blue is thick ice. Darker blue at the edges is thinner ice. White is snow cover. As the poles melt sea levels rise. Watch how almost no ice remains at the north pole in July and August now
--------NORTH POLE ICE-----(TODAY)------SOUTH POLE ICE------

----Last 30 days of North Pole Ice-----

This IMAGE shows winds (shaded areas) and contour lines of pressure where storms may form -
Below you see current pressure and high altitude wind systems over America. H's are highs and L's are lows. The number next to the letter is the actual pressure. The circles around the letter show you the shape;. Hurricanes are always lows. High's can push hurricanes away. The little sticks lean away from wind. More flags on the sticks' ends mean stronger winds. Strong cross winds over lows can prevent hurricane formation but hurricanes once formed will show very high circular winds. The colored lines and shapes are temperatures at high altitude in centigrade.

Click here to see the latest popular music!
Click here to see TheBestScienceFiction
Current Convective Watches
Day 1 Convective Outlook
Day 2 Convective Outlook
Click here to see the latest popular music!
Click here to see TheBestScienceFiction
global sea surface temperature anomaly
carribean sea surface temperature anomaly
Global view Pacific Ocean
LIVE IMAGE! This satellite image shows the weather of the Asian Pacific ocean. Japan, China, Indonesia, Vietnam and Korea.
Global view Indian & Pacific Ocean
LIVE IMAGE! This satellite image shows the weather of the Indian ocean. Including East Africa, India, Indonesia, and Australia.
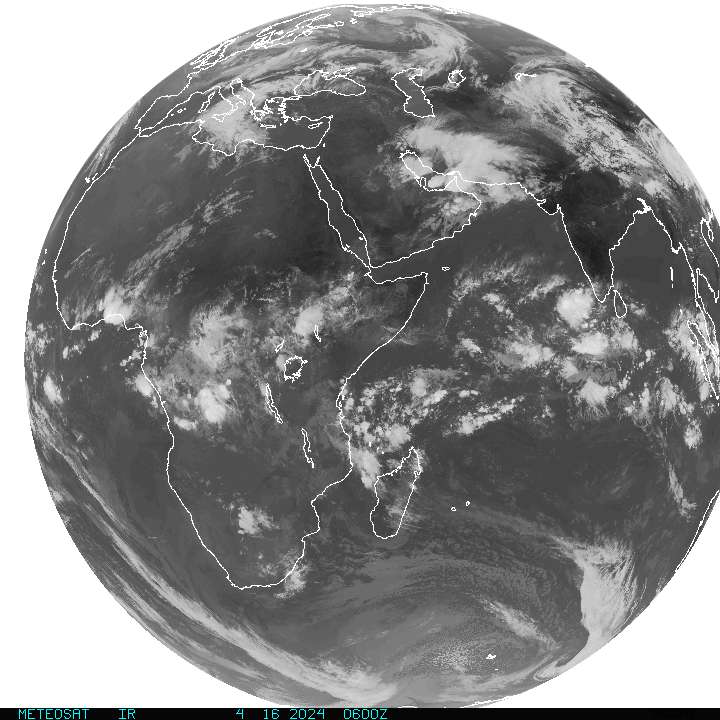
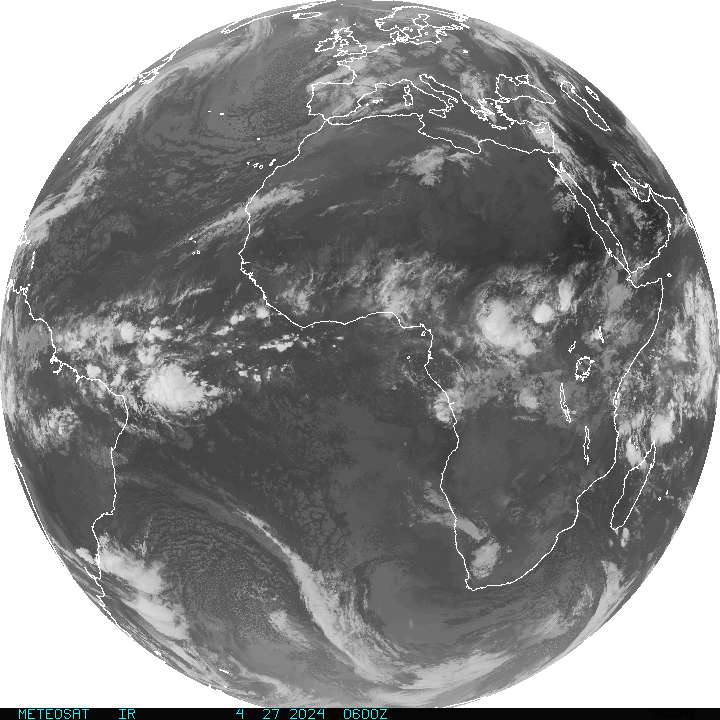
Global view Atlantic Ocean
LIVE IMAGE! This satellite image shows the weather of Europe and Africa.
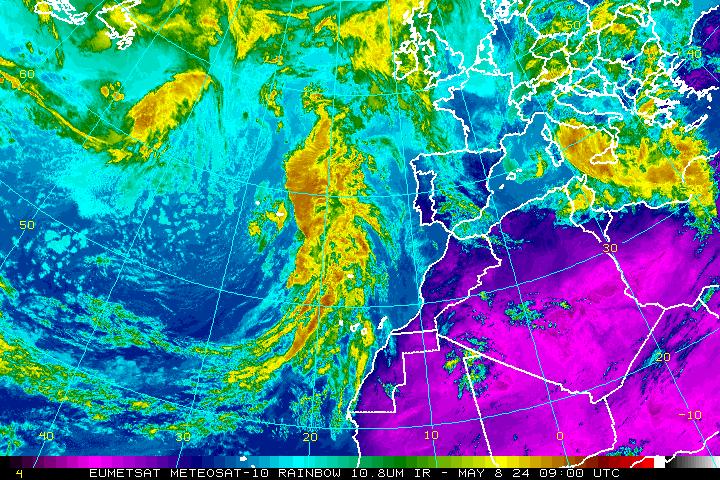
Central Europe
LIVE IMAGE! This satellite image shows the weather of Central Europe.
Arabian Peninsula
LIVE IMAGE! This satellite image of the Middle East shows the Arabian Peninsula.

South Pacific Global Satellite Image -Australia just below center, Japan above center, China left of center LIVE IMAGE! This is a view of the Pacific Ocean and Asia west of Hawaii. Notice the Hawaiian islands outlined on the far upper right side at the edge of the globe. Keep an eye on storms approaching those islands. Hawaii is at great risk from the new superstorms too! And also realize that storms approaching Japan and Asia can affect prices of electronics and chip markets.

annual tornados report


Annual Severe Weather Report Summary


-------------Special Radiation/Fukushima monitoring section-----------
Fukishima Live Camera 1
Fukishima Live Camera 2
TBS/JNN live WEBCAM - Fukushima Daiichi
StormSurf.com embeddable wind prediction map
LIVE IMAGE! This shows current Radiation Network readings across the USA.

Santa Monica (left)and Glendale (right)live Geiger counters (sorry about the ads. mute volume)
Click here to see the latest popular music!
Click here to see TheBestScienceFiction
The following DVDs have excellent hurricane footage and are excellent documentaries about our changing weather and the recent hurricane seasons.
DVDs
It isn't just global warming anymore. The warming happened over the past 50-200 years as any number of books can explain. The book "Boiling Point" is especially recommended reading and can be found in our Book Selections .
Now the globe is comparatively boiling. With hotter oceans we were warned there would be much stronger storms. Now they have come. One huge storm after another right off Florida and monsters forming off western Africa and Central America. They lob themselves repeatedly like slow hand grenades at Florida, the Gulf states and Hawaii like in some science fiction movie. On Sept 19th, 2005 there were five -FIVE!- hurricanes and the remnants of two others surrounding the U.S.A. and it isn't even the peak of the hurricane season yet!
But it is no movie. It is the future of most hurricane seasons to come. These super hurricanes as featured in these documentaries will affect everything from insurance, home building, stock markets and investments, interest rates, unemployment, the economy, politics, land use, the environment, even opinions about iraq war expenditures.
The 2019 Atlantic Hurricane season names are
Andrea Barry Chantal Dorian Erin Fernand Gabrielle Humberto Imelda Jerry Karen Lorenzo Melissa Nestor Olga Pablo Rebekah Sebastien Tanya Van Wendy 2020 Arthur Bertha Cristobal Dolly Edouard Fay Gonzalo Hanna Isaias Josephine Kyle Laura Marco Nana Omar Paulette Rene Sally Teddy Vicky Wilfred
The 2019 Pacific Hurricane season names are
2019 Alvin Barbara Cosme Dalila Erick Flossie Gil Henriette Ivo Juliette Kiko Lorena Mario Narda Octave Priscilla Raymond Sonia Tico Velma Wallis Xina York Zelda 2020 Amanda Boris Cristina Douglas Elida Fausto Genevieve Hernan Iselle Julio Karina Lowell Marie Norbert Odalys Polo Rachel Simon Trudy Vance Winnie Xavier Yolanda Zeke
These summers the water gets as hot in the gulf as the satellites can record. During those times these Hurricanes easily reach Category 4 or 5. Summer peak water temperatures will be hotter the rest of our lives. At summer peaks the super hot water extends all the way out of the gulf and into the Cuban and Antilles islands - so this is exactly where the new Hurricanes form. During those times storms will be strong before even entering the gulf unlike Katrina which revved up only after entering the gulf.
Click here to see the latest popular music!
Click here to see TheBestScienceFiction
LIVE IMAGE! California/Nevada Earthquakes from the past week show up in this image.


Because for the remainder of our lives our nation and the world is going to be dealing with competitive political pressures for preparedness and response resources.
And because all levels of our government seems to have difficulty actually planning for impending disasters even when fully warned, a lot of what other states need to do will need to be done by us pushing our own politicians NOW.
For example:
1. Stock piling the gas and water pipes in place along the San Andreas to deal with line breakage’s that will occur when it slips.
2. Having the repair materials ready and the repair personnel on a reliable "on call" system.
3. Recognizing that many of those personnel will likely be repairing Miami or New Orleans or Texas or Iraq so having three or four levels of back up primary responders and training them NOW.
4. All citizens should form a public city plan about who, how and when evacuations and home demolitions should occur after a quake or hurricane happens (or would you like the bulldozer driver to decide whether your house is salvageable like they will be doing in New Orleans.) This is never talked about but don't you think people ought to have a say in whether or not they can reenter their own homes and neighborhoods and salvage anything? Or should some bureaucrat be allowed under emergency authority to red tag everything you own and leaving you with no say in whether your last possessions are bulldozed?
5. All cities need to stockpile resources and make plans now before the next big hurricane takes out another city like Miami this year - as it is very likely to do (little did we know Rita would fulfill our prediction so quickly - and Rita won't be the last of this year!)
There won't be any money or attention left after that happens!
For more on earthquakes including possible triggering by electrical forces such as the solar wind see www.electricquakes.com
Email us with your thoughts. We never Spam. *Click here to Email us please. We love your comments and never spam*
*Email this page location to a friend or skeptic!
Books
These excellent books are recommended reading. your purchase helps support this site. The book "Boiling Point" below is especially recommended reading.
| Great Books |
The following DVDs are excellent documentaries about our changing weather and the recent hurricane seasons.
DVDs
| DVD's |
www.globalboiling.com , www.supercanes.com , www.electricquakes.com
| For more information.. |
Global Warming Books

|
Global Warming DVD's
|
Global Warming Video Tapes
|

The Global Boil and GlobalBoiling, Supercanes and Electricquakes are terms created by and trademarks of the owner. All rights are reserved.
Environmental Network Links:(will take you to offsite pages. Just scroll down for this page)
Climate Change
,
Historic Hurricanes
,
Earthquakes!
,
Electric Cars
,
www.vivzizi.com
,
TheBestMusic
,
TheBestScienceFiction
,
See the earth live from satellites
See the hottest selling music now!

If you have a problem viewing this page or a comment click
here
to email us.
or click a link in the index below to jump directly to that part of the page
| Current Weather Radar |
| California US Drought Map |
| Expected High Temperature Today Map |
| Annual Weather Comparision |
| Current storm tracking! |
| North Pole Ice Conditions |
| Current Ocean Temperatures! |
| Asian/South Pacific Storm imagery |
| Atlantic Global Imagery |
| Pressure waves |
| Gulf weather movie |
| Gulf of Mexico closeup |
| Melting Poles & Ice Caps |
| Fukushima Meltdown Radiation related feeds |
| Live Radiation Network Geiger Counter readings |
| Books |
| DVDs |
weather forecasts, tornadoes and hurricanes, climate change and globalwarming information! All images are the most recent live data from government sources such as The National Hurricane Center. Check often when storms approach or to find out will it rain today?, will it rain?, is it going to rain?, show me the weather, show me the weather for, tornado watch, tornado warning, when will the hurricane hit?
For more on earthquakes including possible triggering by electrical forces such as the solar wind see www.electricquakes.com


